Power BI Visualization Types
Unlock the full potential of your Power BI data with our in-depth guides to every visualization type. Master best practices, real-world use cases, and hands-on examples with sample data and project files. Elevate your reports and dashboards today!
Power BI Categorical Visuals
We use categorical visuals for comparative data analysis. They are best used when trying to compare data values (i.e. measures) across categories (i.e. Dimensions, or Dims for short). These visuals have a far less detailed view of the data, but it is very easy to distinguish the differences of the values within the chosen Dim.
Power BI provides several charts for comparative data charts, these are:
Bar and Column Charts
Pie and Doughnut Charts
Treemap Visual
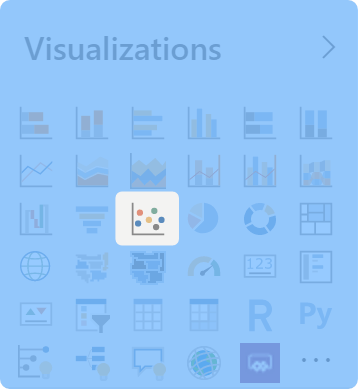
Scatter Charts


Power BI Trend Visuals
Trend visuals are two-axis graphs that allow you to compare a series of data that share x-axis values but have different values on their y-axis. Two-axis graphs can combine two different graphs into one.
Common examples of two-axis graphs compare revenue and year-by-year growth, stock closing price and volume change over time, rainfall and temperature, blood pressure and weight over a length of time.
When using the term Trend Data, A two-axis graph displays and compares values over a length of time. Power BI provides many options for trend data, each with their own focus. The idea for each of the visuals, though, is to draw attention to the total value across a length of time.
Power BI provided visuals for trend data charts are:
Line and Area Charts
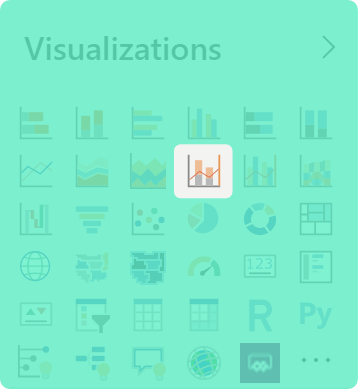
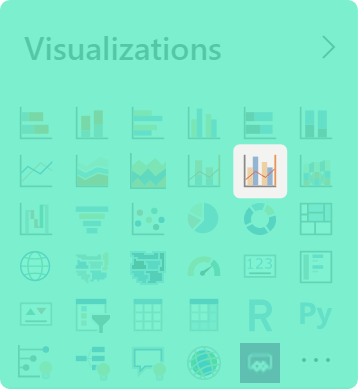
Combo Charts
Ribbon Charts
Waterfall and Funnel Charts


Learn Power BI by Studying Real-World Reports
Download Free PBIX report files used in real-world situation and amend them to suite your own projects and reports.

Directory Listing Report
This PBIX file shows what is possible using Power BI various Map Visuals (Map, Filled Map and ESRI ArcGIS). The data was taken from a listing on Microsoft website, transformed and built to allow for Geo grouping, filtering and price comparison.

Demystifying Business Intelligence
This Book will introduce the reader to the world of Business Intelligence, what is it and what are its uses. In the book we explain in detail the various components that make up a BI solution for any size of business and professionals.