Power BI Stacked Area Chart

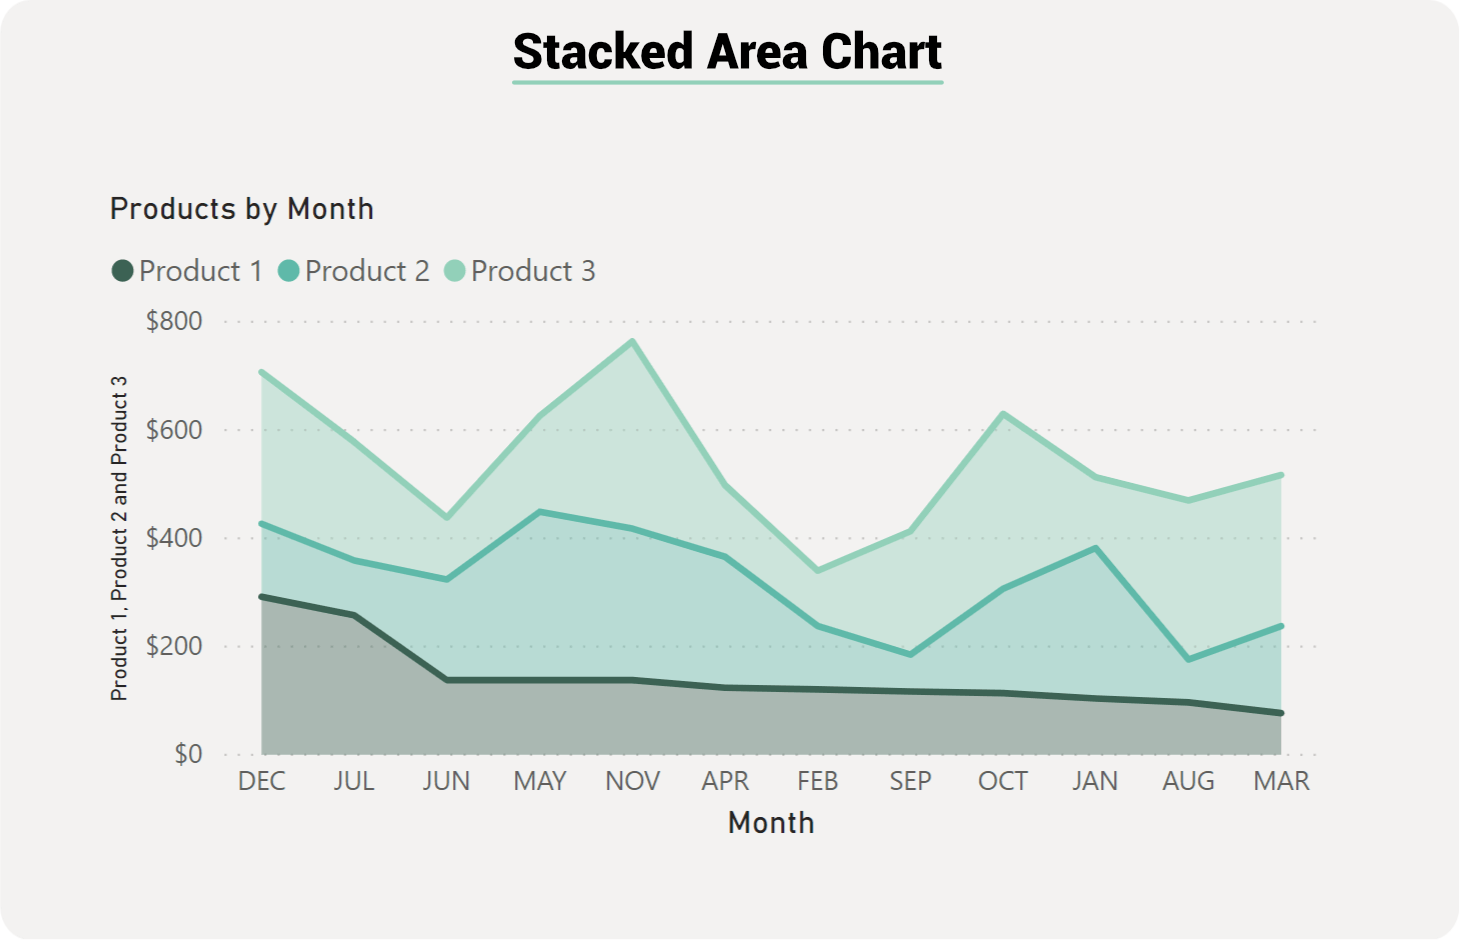
The Stacked Area chart is an extension to the Area Chart. As with the Area Chart, the Stacked Area chart is often used to visualise a trend in data over intervals of time, the difference is that the Stacked Areas are used to display how several quantities combine to make a whole, as it shows how each part or category contributes to the whole amount.