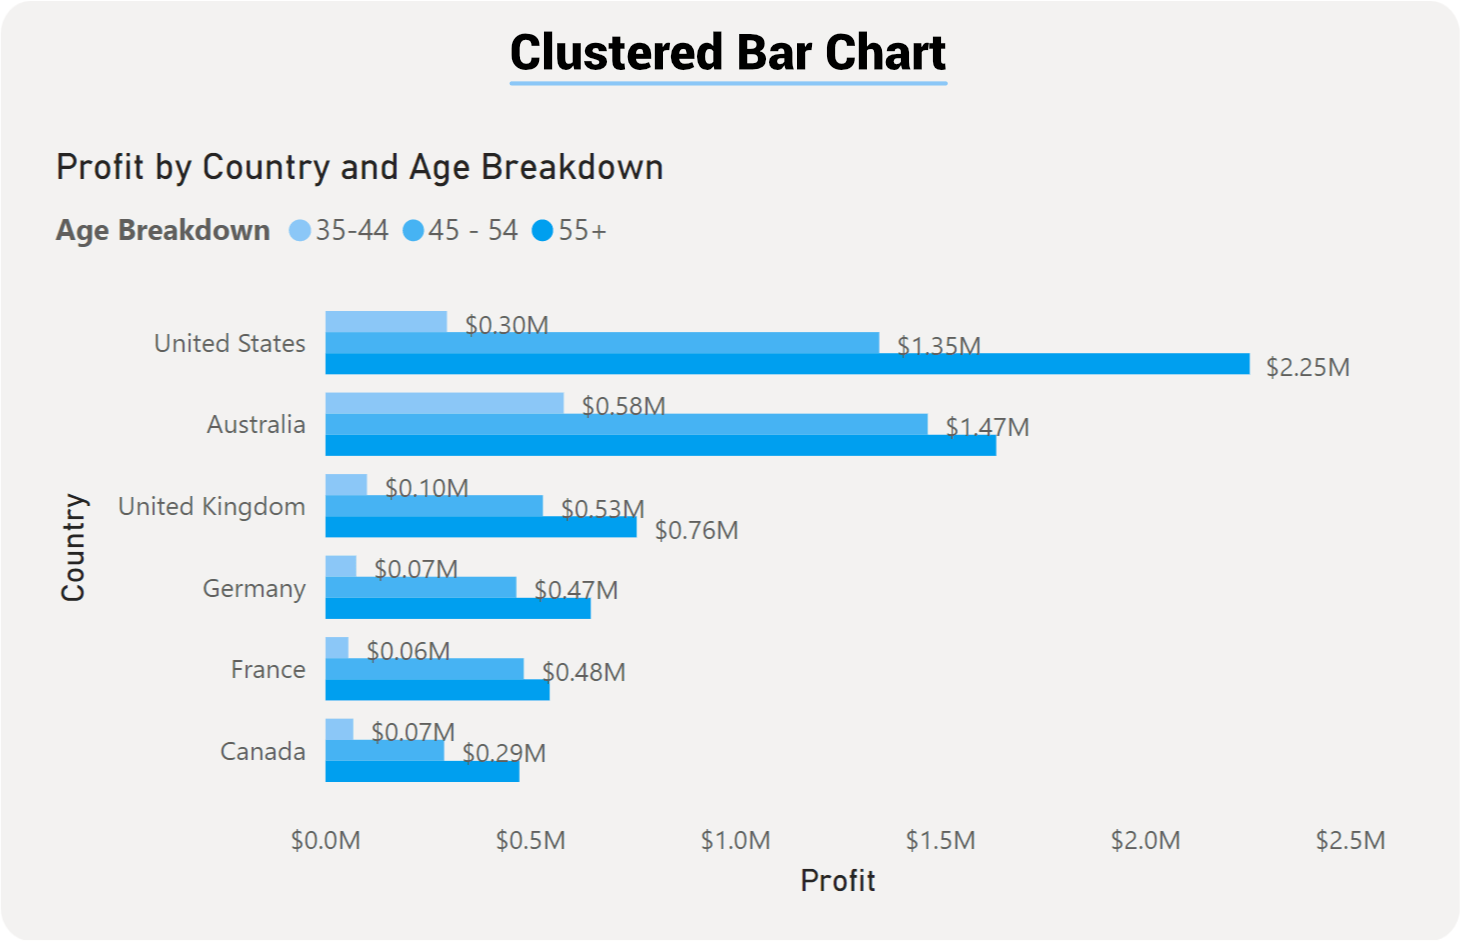
Power BI Clustered Bar Chart
Power BI Clustered Bar charts display values (i.e. measures) where the length of the bar or column is proportional to the data. Clustered Bar charts are means to display a measure against a single dimension. A second dimension can break the primary dimension further more. But it always breaks the measures down into the primary dimension, which is the main x-axis.