
Data Analytics Blog
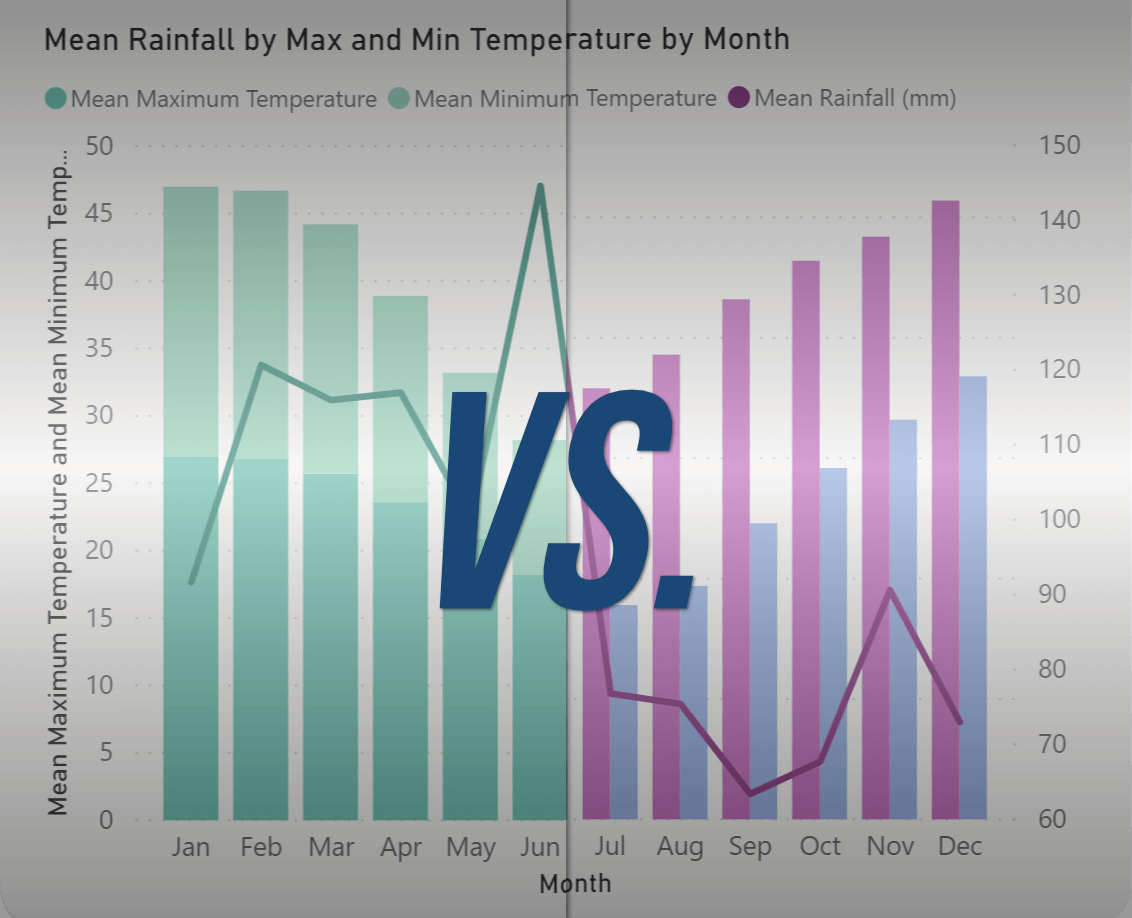
Line and Clustered Column Chart vs. Line and Stacked Column Chart
Dive into the key differences between Power BI's Line & Clustered Column and Line & Stacked Column charts. Understand their unique features, best use-cases, and tips for optimal data visualization. Make informed choices in your next Power BI report.

Unraveling Ribbon Charts: A Guide to Power BI's Powerful Visualization Tool
Unravel the power of Ribbon Charts in data visualization with our comprehensive guide. Explore their uses, best practices, and examples in diverse complexity levels, specifically focusing on their application in Microsoft Power BI. Unlock insights from your data like never before!